
1 Introduction
In our previous post, we identfied four sampling strategies, each coming from either whole blood or plasma. To take this analysis a step further, we analyze the metagenomic sequencing data from various whole blood and plasma based studies. This analysis will help us understand the last piece missing from the puzzle: what viruses are present and detectable in whole blood and plasma using metagenomic sequencing and how do both sample types compare to each other.
We performed a literature search for large (>100M read pairs), untargeted whole blood and plasma metagenomic studies. We identified 6 such datasets (Table 1), obtained the raw sequencing data, and processed it with a Kraken2-based computational pipeline to estimate the relative abundance of human-infecting viruses (Methods).
2 Data
| Study | Sample type | Viral enrichment | Sequencing assay | Country | Read pairs | Reference |
|---|---|---|---|---|---|---|
| Cebria-Mendoza et al. (2021) | Plasma | Yes | DNA + RNA | Spain | 230M | link |
| Thijssen et al. (2023) | Plasma | Yes | DNA + RNA | Iran | 116M | link |
| Mengyi et al. (2023) | Plasma | No | DNA | China | 3.4B | link |
| Thompson et al. (2023) | Whole blood | No (human focused study) | RNA | USA | 27.7B | link |
| O’Connell et al. (2023) | Whole blood | No (human focused study) | RNA | USA | 3.1B | link |
| Aydillo et al. (2022) | Whole blood | No (human focused study) | RNA | USA | 1.7B | link |
2.1 Plasma
2.1.1 Cebria-Mendoza et al. (2021)
This dataset from Spain has 60 samples, each derived from plasma pools of 8-13 people from Spain. In total, 567 healthy individuals contributed to these pools. For each pooled sample, a combined DNA and RNA library preparation was performed, resulting in a single sequencing output that captures both nucleic acid types. This approach provides comprehensive genetic information but precludes separate analysis of DNA and RNA from individual samples.
TODO: Cebria-Mendoza does viral enrichment. Briefly … . More information can be found here.
Full analysis can be found here
2.1.2 Thijssen et al. (2023)
This dataset from Iran has 21 samples, each derived from plasma pools of 5 people from Iran. In total, 100 healthy individuals contributed to these pools. For each pooled sample, a combined DNA and RNA library preparation was performed, resulting in a single sequencing output that captures both nucleic acid types, with Illumina NextSeq 500, producing 2x150 bp reads.
TODO: Thijseen does viral enrichment. Briefly … . More information can be found here
Full analysis can be found here
2.1.3 Mengyi et al. (2023)
This dataset from China has 201 samples, each derived from plasma pools of 160 donations from 7 different locations between 2012-2018. In total, 10,720 donations contributed to these pools (we do not know the number of individuals). They did DNA-sequencing for each pool, with Illumina HiSeq 4500, producing 2x150 bp reads.
Disclaimer: When going through the sample preparation protocol, we noticed that the authors mentioned centrifuging whole blood and sequencing the supernatant, however to get plasma you would have to sequence the precipitate. We tried contacting the authors, but were unable to get a response. Given that the paper references plasma everywhere else, we’ve decided to consider this a plasma dataset.
Full analysis can be found here
2.2 Whole blood
2.2.1 Thompson et al. (2023)
This dataset from the USA has 417 samples, with 353 individuals positive for SARS-CoV-2 and 64 individuals negative, for a total of 417 individuals. They did RNA-sequencing for each sample, with Illumina NovaSeq 6000, producing 2x100 bp reads.
Full analysis can be found here
2.2.2 O’Connell et al. (2023)
This dataset from the USA has 138 samples, with 138 individuals presenting to the emergency department with symptoms or complications. They did RNA-sequencing for each sample using Illumina NovaSeq 6000, producing 2x150 bp reads.
Full analysis can be found here
2.2.3 Aydillo et al. (2022)
This dataset from the USA has 53 samples, with 53 healthy individuals. They did RNA-sequencing for each sample, with Illumina NovaSeq 6000, producing 2 x 95 bp reads.
Full analysis can be found here
3 Methods
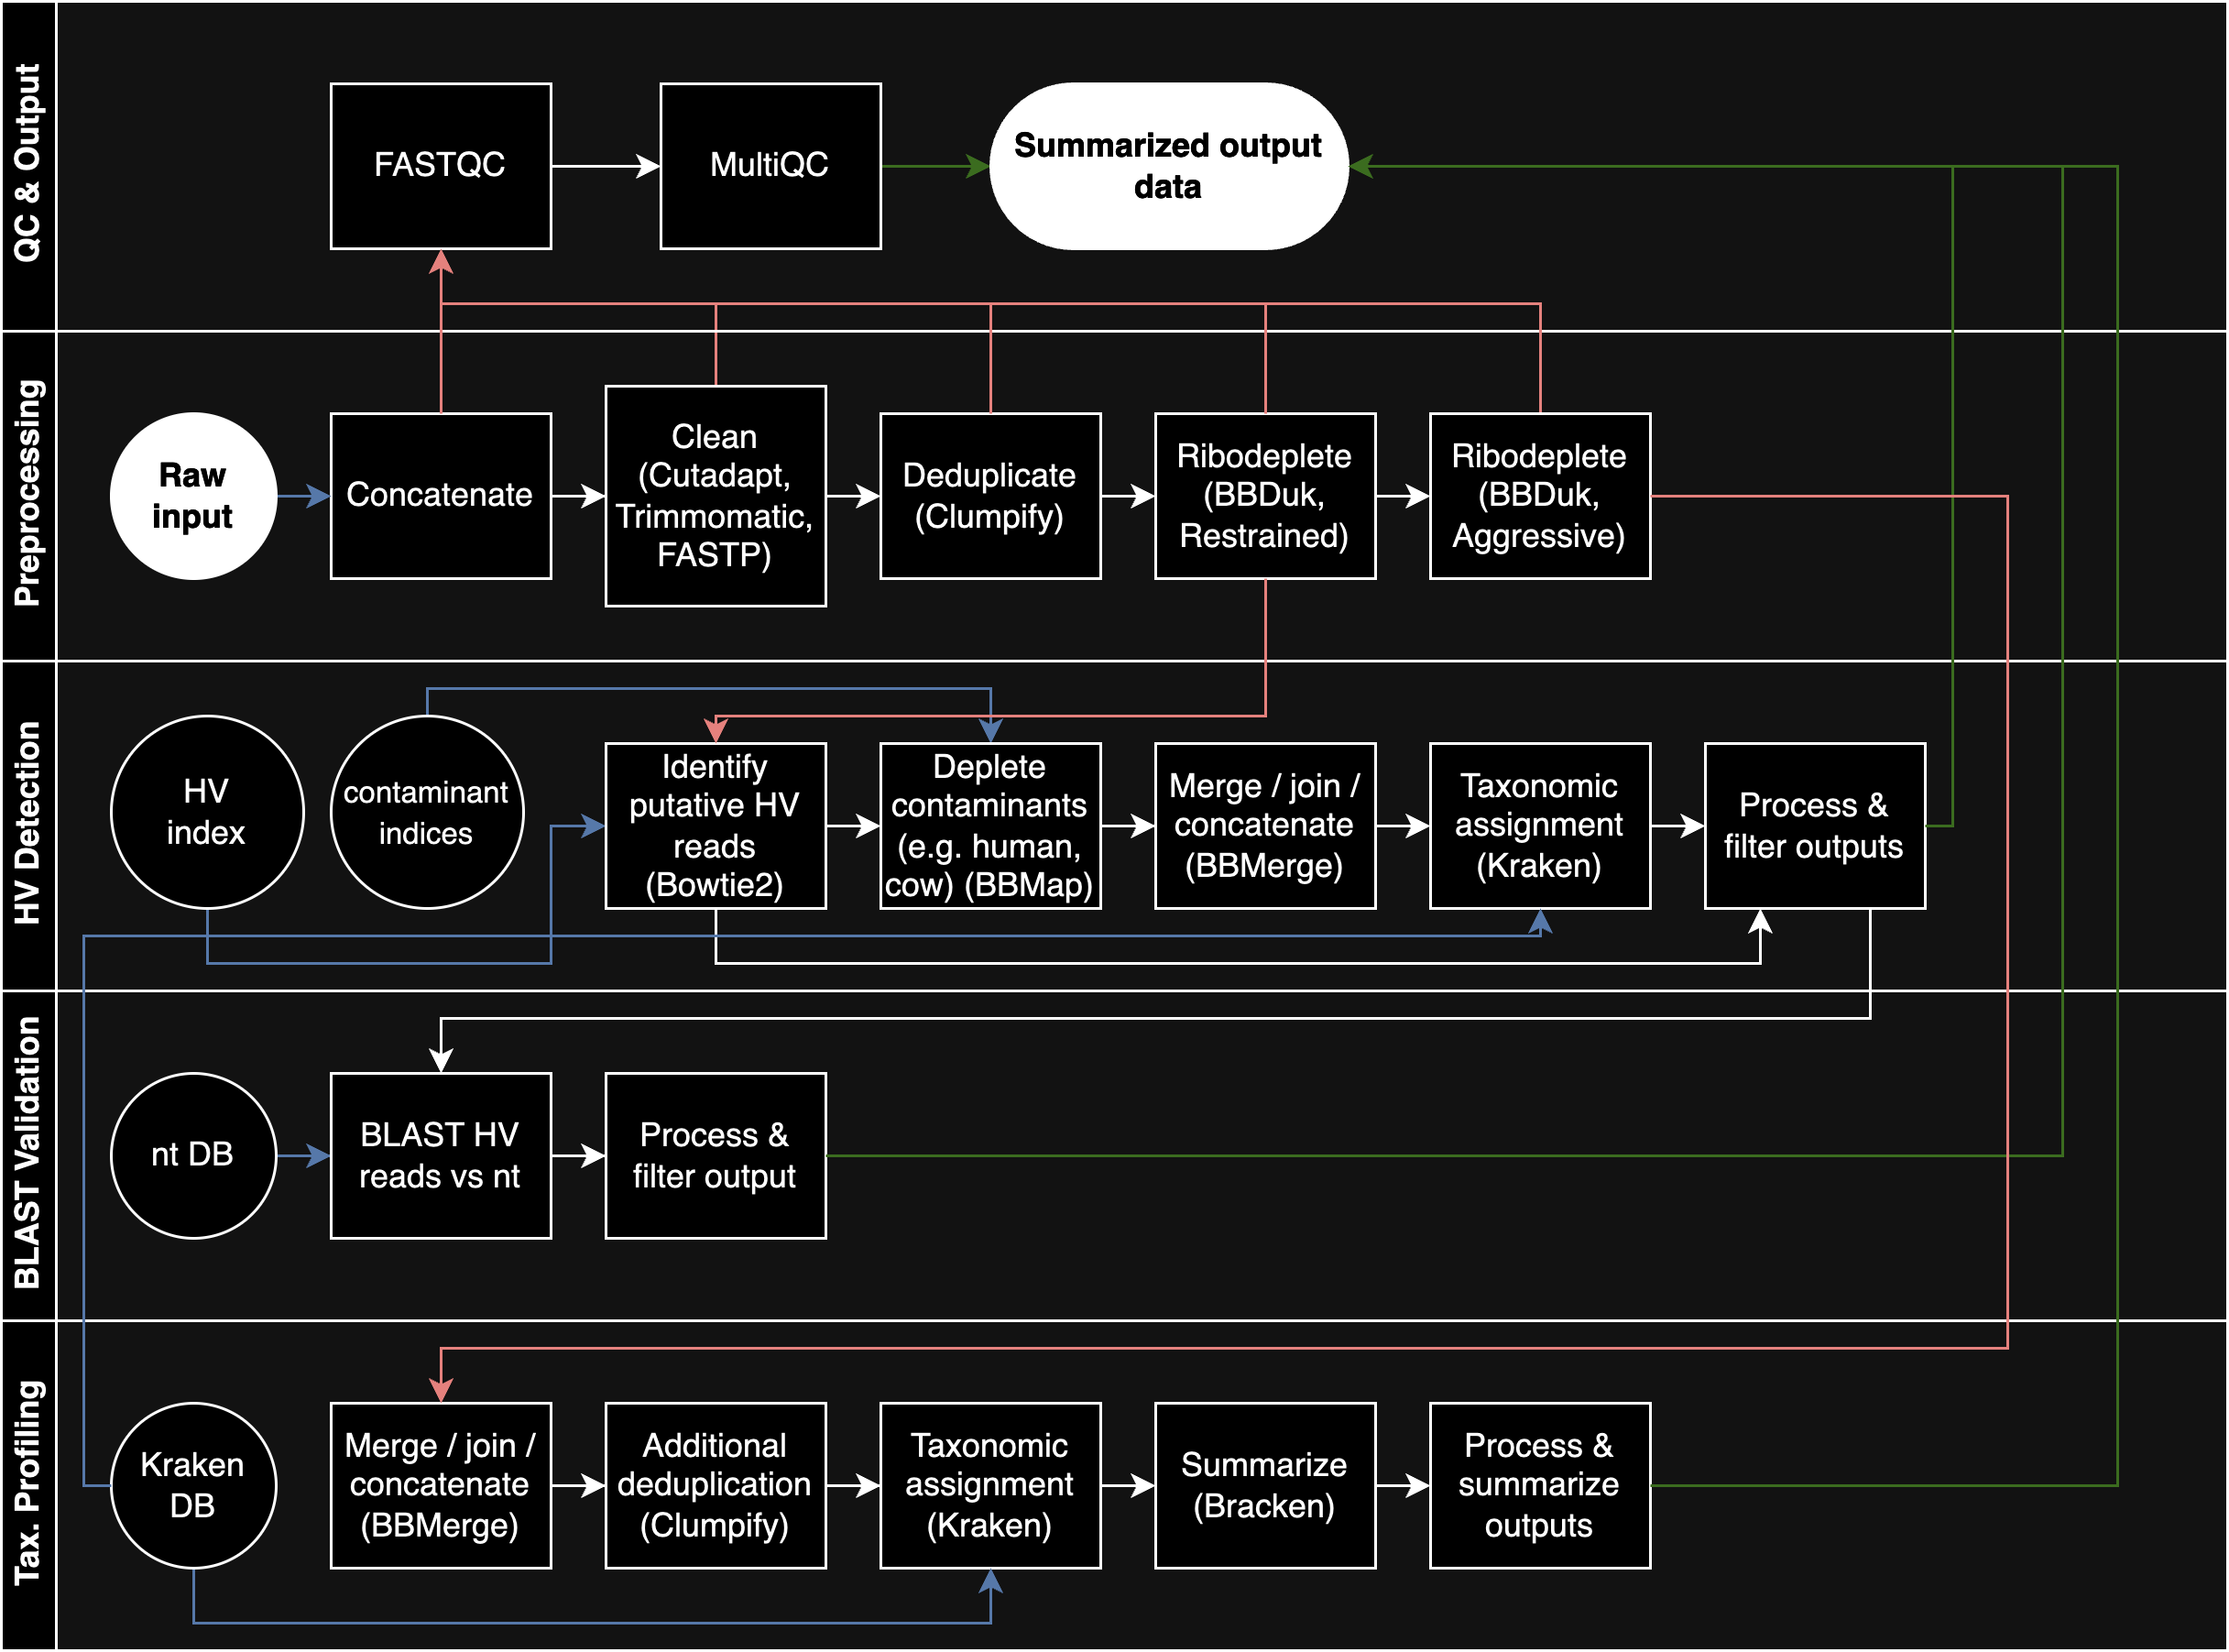
The pipeline for analysis was developed by William Bradshaw, and slightly modifyed by me. It can be found here. Here is a brief description of the pipeline, taken directly from the README:
The run workflow then consists of four phases:
- A preprocessing phase, in which input files undergo adapter & quality trimming, deduplication, and ribodepletion.
- A taxonomic profiling phase, in which Kraken2 is used to assess the overall taxonomic composition of the input data and assess how it changes across different steps in the preprocessing phase.
- A viral identification phase, in which a custom multi-step pipeline based around Bowtie2 and Kraken2 is used to sensitively and specifically identify human-infecting virus (HV) reads in the input data for downstream analysis.
- A final QC and output phase, in which FASTQC, MultiQC and other tools are used to assess the quality of the data produced by the pipeline at various steps and produce summarized output data for downstream analysis and visualization.
4 Results
4.1 Kingdom composition
On average, whole blood datasets have higher human fractions than plasma datasets (Figure 1, Table 2). Choice of viral enrichment tends to have an impact on kingdom composition, as we can see that Cebria-Mendoza and Thijssen, both of which did viral enrichment, have significanlty lower human read fractions than Mengyi, despite all datasets coming from plasma. Even comparing viral enrichment methods, we can see that Cebria-Mendoza has a much higher fraction of viral reads compared to Thijssen.
Sample prep can lead to large variations in how many human reads end up in your sample. Cebria Mendoza is an example of highly efficient human read removal in plasma. Probably this is more challenging in whole blood, but may still be possible particularly if looking at the extracellular content. All of the whole blood studies were not focused on detecting non-human microbes. We can try to get a better understanding of the performance of whole blood by controlling for human reads (Table 3). The number of viral reads becomes much higher when we control for human reads, making it comparable to the plasma datasets.
| sample_type | dataset | Unassigned | Bacterial | Archaeal | Viral | Human |
|---|---|---|---|---|---|---|
| plasma | Cebria-Mendoza et al. (2021) | 42.16360 % | 49.89189 % | 0.03311 % | 5.98442 % | 1.92698 % |
| plasma | Thijssen et al. (2023) | 73.12558 % | 4.51508 % | 0.01280 % | 0.03373 % | 22.31281 % |
| plasma | Mengyi et al. (2023) | 1.33651 % | 0.26607 % | 0.00096 % | 0.01302 % | 98.38344 % |
| whole-blood | Thompson et al. (2023) | 0.11189 % | 0.01282 % | 0.00007 % | 0.00027 % | 99.87494 % |
| whole-blood | O’Connell et al. (2023) | 0.08717 % | 0.05051 % | 0.00004 % | 0.00011 % | 99.86217 % |
| whole-blood | Aydillo et al. (2022) | 0.34940 % | 0.10959 % | 0.00061 % | 0.00028 % | 99.54011 % |
| Average | ||||||
| plasma | —- | 38.87523 % | 18.22435 % | 0.01562 % | 2.01039 % | 40.87441 % |
| whole-blood | —- | 0.18282 % | 0.05764 % | 0.00024 % | 0.00022 % | 99.75908 % |
Table 2: Kingdom composition. Top: Composition across datasets. Bottom: Composition across sample types.
| sample_type | dataset | Unassigned | Bacterial | Archaeal | Viral |
|---|---|---|---|---|---|
| plasma | cebriamendoza2021 | 42.99205 % | 50.87219 % | 0.03376 % | 6.10200 % |
| plasma | thijssen2023 | 94.12824 % | 5.81187 % | 0.01648 % | 0.04341 % |
| plasma | mengyi2023 | 82.67637 % | 16.45903 % | 0.05935 % | 0.80525 % |
| whole-blood | thompson2023 | 89.47051 % | 10.25520 % | 0.05890 % | 0.21539 % |
| whole-blood | oconnell2023 | 63.24574 % | 36.64757 % | 0.02763 % | 0.07906 % |
| whole-blood | aydillo2022 | 75.97604 % | 23.83067 % | 0.13290 % | 0.06039 % |
| Average | |||||
| plasma | —- | 73.26555 % | 24.38103 % | 0.03653 % | 2.31689 % |
| whole-blood | —- | 76.23076 % | 23.57781 % | 0.07314 % | 0.11828 % |
Table 3: Kingdom composition controlled for human reads. Top: Composition across datasets. Bottom: Composition across sample types.
4.2 Human-infecting viruses
4.2.1 Overview

| dataset | RA | RA (control for human reads) | sample_type | Samples with > 5 HV reads | Samples with HV reads | Average number of reads |
|---|---|---|---|---|---|---|
| Thijssen et al. (2023) | 1.60e-04 | 1.82e-04 | plasma | 21/21 (100.0%) | 21/21 (100.0%) | 5.6 M |
| Mengyi et al. (2023) | 9.84e-05 | 5.11e-04 | plasma | 140/201 (69.7%) | 191/201 (95.0%) | 17.1 M |
| Thompson et al. (2023) | 1.51e-06 | 3.18e-06 | whole-blood | 69/417 (16.5%) | 202/417 (48.4%) | 66.4 M |
| O’Connell et al. (2023) | 2.62e-08 | 8.87e-08 | whole-blood | 1/138 (0.7%) | 45/138 (32.6%) | 22.5 M |
| Aydillo et al. (2022) | 3.58e-07 | 7.49e-07 | whole-blood | 6/53 (11.3%) | 15/53 (28.3%) | 32.8 M |
Table 4: Relative abundance of human-infecting viruses in each dataset, with and without controlling for human reads.
| sample_type | RA | RA (control for human reads) |
|---|---|---|
| plasma | 1.04e-04 | 4.80e-04 |
| whole-blood | 1.07e-06 | 2.26e-06 |
Table 5: Relative abundance of human-infecting viruses in each sample type, with and without controlling for human reads.
The relative abundance of human-infecting viruses is higher in plasma than whole blood (Figure 2, Table 4, Table 5).
4.2.2 Family composition
Warning: The `size` argument of `element_line()` is deprecated as of ggplot2 3.4.0.
ℹ Please use the `linewidth` argument instead.
TODO
4.2.3 Species composition

To gain a more granular understanding of each sample type, we can look at the relative abundance of specific viruses in each sample type that may be of interest (totalling to 21): those that are linked to disease, characterized by latent infections (this is in accordance to the NAO’s interest to detecting “stealth” pandemics), and those that are blood-borne. We get a wide range of human infecting viruses including Hepatitis, HIV, Herpes, and HPV. Importantly, most viruses seem to be detected in both sample types. When comparing the coverage of all viruses in each sample type, we see that plasma contains 104 unique viruses, whereas whole blood only countains about 56. However, when looking at these closely, we see that the majority of viruses captured by plasma all come from Anellovirdae, a non-harmful family of viruses. When we only look at the viruses specified above, we find that plasma contains 18 out of the 21 viruses, whereas whole blood contains 17 out of the 21 viruses. Specifically, plasma uniquely contains HBV, whereas whole blood uniquely contains HTLV-1 and HTLV-2.