2023-10-11 Analyze qPCR standard curves

Author

Dan Rice

Published

October 11, 2023

Objectives

Test out the standard curves from qPCR standard curve troubleshooting.

Preliminary work

Exported csv files from Olivia’s eds file uploads.

Data import

library(here)
here() starts at /Users/dan/notebook
library(readr)
library(dplyr)

Attaching package: 'dplyr'
The following objects are masked from 'package:stats':

    filter, lag
The following objects are masked from 'package:base':

    intersect, setdiff, setequal, union
library(purrr)
library(stringr)
library(ggplot2)
library(tidyr)
library(broom)
data_dir <-
  here("~", "airport", "[2023-10-05] qPCR standard curve troubleshooting")
filename_pattern <- "_Results_"
col_types <- list(
  Target = col_character(),
  Cq = col_double()
)
raw_data <- list.files(
  here(data_dir, "qpcr"),
  pattern = filename_pattern,
  recursive = TRUE,
  full.names = TRUE,
) |>
  print() |>
  map(function(f) {
    read_csv(f,
      skip = 23,
      col_types = col_types,
    )
  }) |>
  list_rbind()
[1] "/Users/dan/airport/[2023-10-05] qPCR standard curve troubleshooting/qpcr/2023-10-05_StdCurve_CalTest_Results_20231012_125325.csv"
Warning: One or more parsing issues, call `problems()` on your data frame for details,
e.g.:
  dat <- vroom(...)
  problems(dat)
print(raw_data)
# A tibble: 69 × 21
    Well `Well Position` Omit  Sample Target Task     Reporter Quencher
   <dbl> <chr>           <lgl>  <dbl> <chr>  <chr>    <chr>    <chr>   
 1     1 A1              FALSE 100000 Cov2   STANDARD FAM      NFQ-MGB 
 2     2 A2              FALSE 100000 Cov2   STANDARD FAM      NFQ-MGB 
 3     3 A3              FALSE 100000 Cov2   STANDARD FAM      NFQ-MGB 
 4     5 A5              FALSE 100000 Noro   STANDARD FAM      NFQ-MGB 
 5     6 A6              FALSE 100000 Noro   STANDARD FAM      NFQ-MGB 
 6     7 A7              FALSE 100000 Noro   STANDARD FAM      NFQ-MGB 
 7     9 A9              FALSE 800000 PMMoV  STANDARD VIC      NFQ-MGB 
 8    10 A10             FALSE 800000 PMMoV  STANDARD VIC      NFQ-MGB 
 9    11 A11             FALSE 800000 PMMoV  STANDARD VIC      NFQ-MGB 
10    13 B1              FALSE  10000 Cov2   STANDARD FAM      NFQ-MGB 
# ℹ 59 more rows
# ℹ 13 more variables: `Amp Status` <chr>, `Amp Score` <dbl>,
#   `Curve Quality` <lgl>, `Result Quality Issues` <lgl>, Cq <dbl>,
#   `Cq Confidence` <dbl>, `Cq Mean` <dbl>, `Cq SD` <dbl>,
#   `Auto Threshold` <lgl>, Threshold <dbl>, `Auto Baseline` <lgl>,
#   `Baseline Start` <dbl>, `Baseline End` <dbl>
raw_data |> count(Target)
# A tibble: 3 × 2
  Target     n
  <chr>  <int>
1 Cov2      24
2 Noro      21
3 PMMoV     24
tidy_data <- raw_data |>
  mutate(
    # group = str_extract(Sample, "^[0-9]"),
    # replicate = str_extract(Sample, "[A-Z]$"),
    quantity = as.double(Sample),
  ) |>
  glimpse()
Rows: 69
Columns: 22
$ Well                    <dbl> 1, 2, 3, 5, 6, 7, 9, 10, 11, 13, 14, 15, 17, 1…
$ `Well Position`         <chr> "A1", "A2", "A3", "A5", "A6", "A7", "A9", "A10…
$ Omit                    <lgl> FALSE, FALSE, FALSE, FALSE, FALSE, FALSE, FALS…
$ Sample                  <dbl> 1e+05, 1e+05, 1e+05, 1e+05, 1e+05, 1e+05, 8e+0…
$ Target                  <chr> "Cov2", "Cov2", "Cov2", "Noro", "Noro", "Noro"…
$ Task                    <chr> "STANDARD", "STANDARD", "STANDARD", "STANDARD"…
$ Reporter                <chr> "FAM", "FAM", "FAM", "FAM", "FAM", "FAM", "VIC…
$ Quencher                <chr> "NFQ-MGB", "NFQ-MGB", "NFQ-MGB", "NFQ-MGB", "N…
$ `Amp Status`            <chr> "AMP", "AMP", "AMP", "AMP", "AMP", "AMP", "AMP…
$ `Amp Score`             <dbl> 1.336953, 1.342341, 1.346511, 1.543840, 1.5263…
$ `Curve Quality`         <lgl> NA, NA, NA, NA, NA, NA, NA, NA, NA, NA, NA, NA…
$ `Result Quality Issues` <lgl> NA, NA, NA, NA, NA, NA, NA, NA, NA, NA, NA, NA…
$ Cq                      <dbl> 19.98854, 20.39666, 21.45209, 25.67237, 27.788…
$ `Cq Confidence`         <dbl> 0.9907778, 0.9907965, 0.9919563, 0.9951665, 0.…
$ `Cq Mean`               <dbl> 20.61243, 20.61243, 20.61243, 26.99896, 26.998…
$ `Cq SD`                 <dbl> 0.75525700, 0.75525700, 0.75525700, 1.15574184…
$ `Auto Threshold`        <lgl> TRUE, TRUE, TRUE, TRUE, TRUE, TRUE, TRUE, TRUE…
$ Threshold               <dbl> 0.1399036, 0.1399036, 0.1399036, 0.2375444, 0.…
$ `Auto Baseline`         <lgl> TRUE, TRUE, TRUE, TRUE, TRUE, TRUE, TRUE, TRUE…
$ `Baseline Start`        <dbl> 3, 3, 3, 3, 3, 3, 3, 3, 3, 3, 3, 3, 3, 3, 3, 3…
$ `Baseline End`          <dbl> 15, 15, 16, 20, 21, 22, 16, 16, 16, 18, 18, 20…
$ quantity                <dbl> 1e+05, 1e+05, 1e+05, 1e+05, 1e+05, 1e+05, 8e+0…
amp_data <- list.files(
  here(data_dir, "qpcr"),
  pattern = "Amplification Data",
  recursive = TRUE,
  full.names = TRUE,
) |>
  print() |>
  map(function(f) {
    read_csv(f,
      skip = 23,
      col_types = col_types,
    )
  }) |>
  list_rbind() |>
  left_join(tidy_data, by = join_by(Well, `Well Position`, Sample, Omit, Target)) |>
  glimpse()
[1] "/Users/dan/airport/[2023-10-05] qPCR standard curve troubleshooting/qpcr/2023-10-05_StdCurve_CalTest_Amplification Data_20231012_125325.csv"
Warning: The following named parsers don't match the column names: Cq
Rows: 2,760
Columns: 25
$ Well                    <dbl> 1, 1, 1, 1, 1, 1, 1, 1, 1, 1, 1, 1, 1, 1, 1, 1…
$ `Well Position`         <chr> "A1", "A1", "A1", "A1", "A1", "A1", "A1", "A1"…
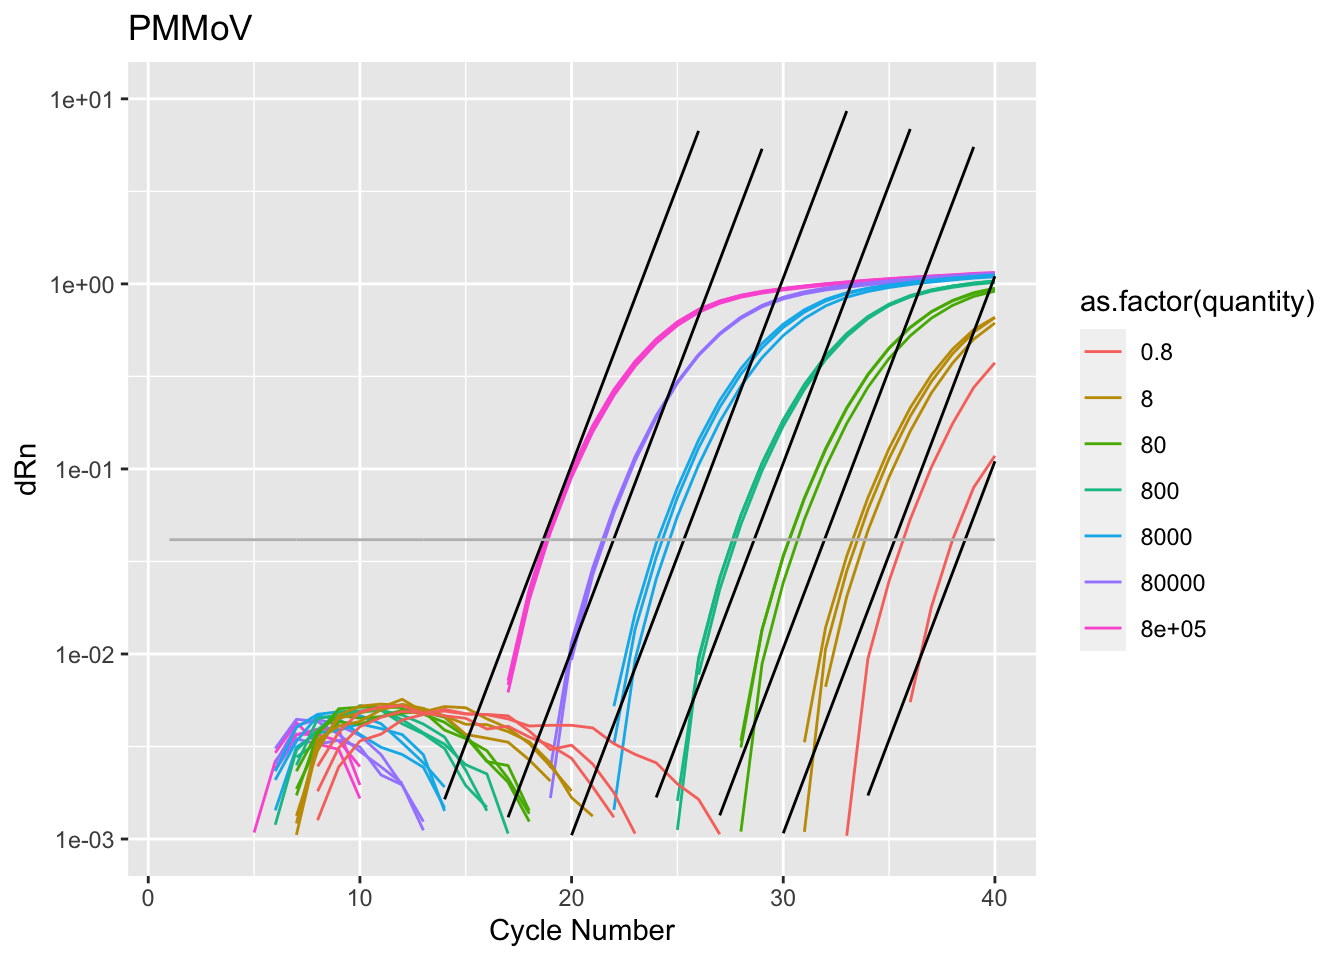
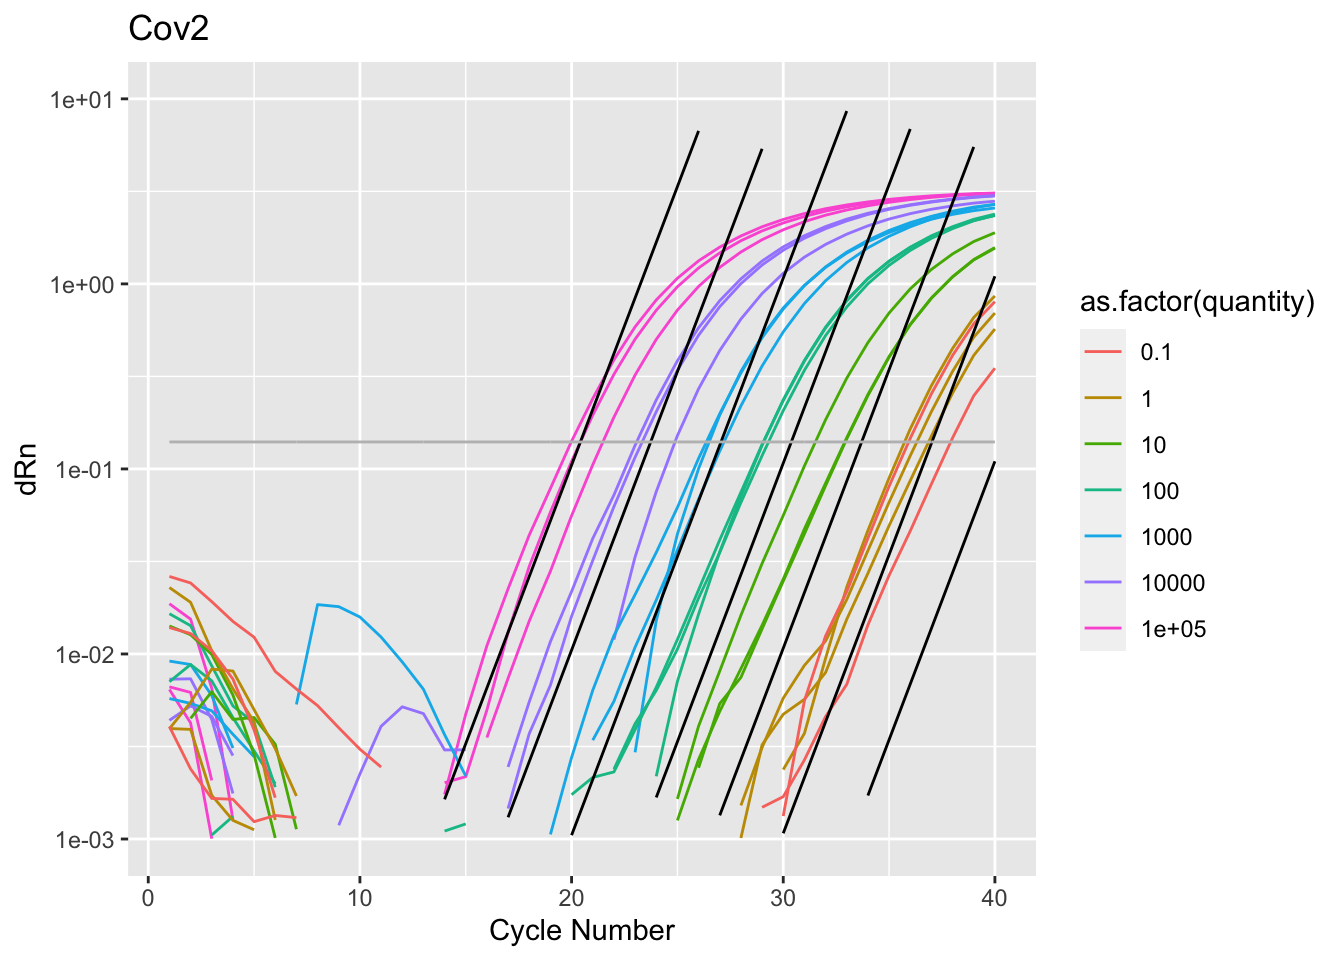
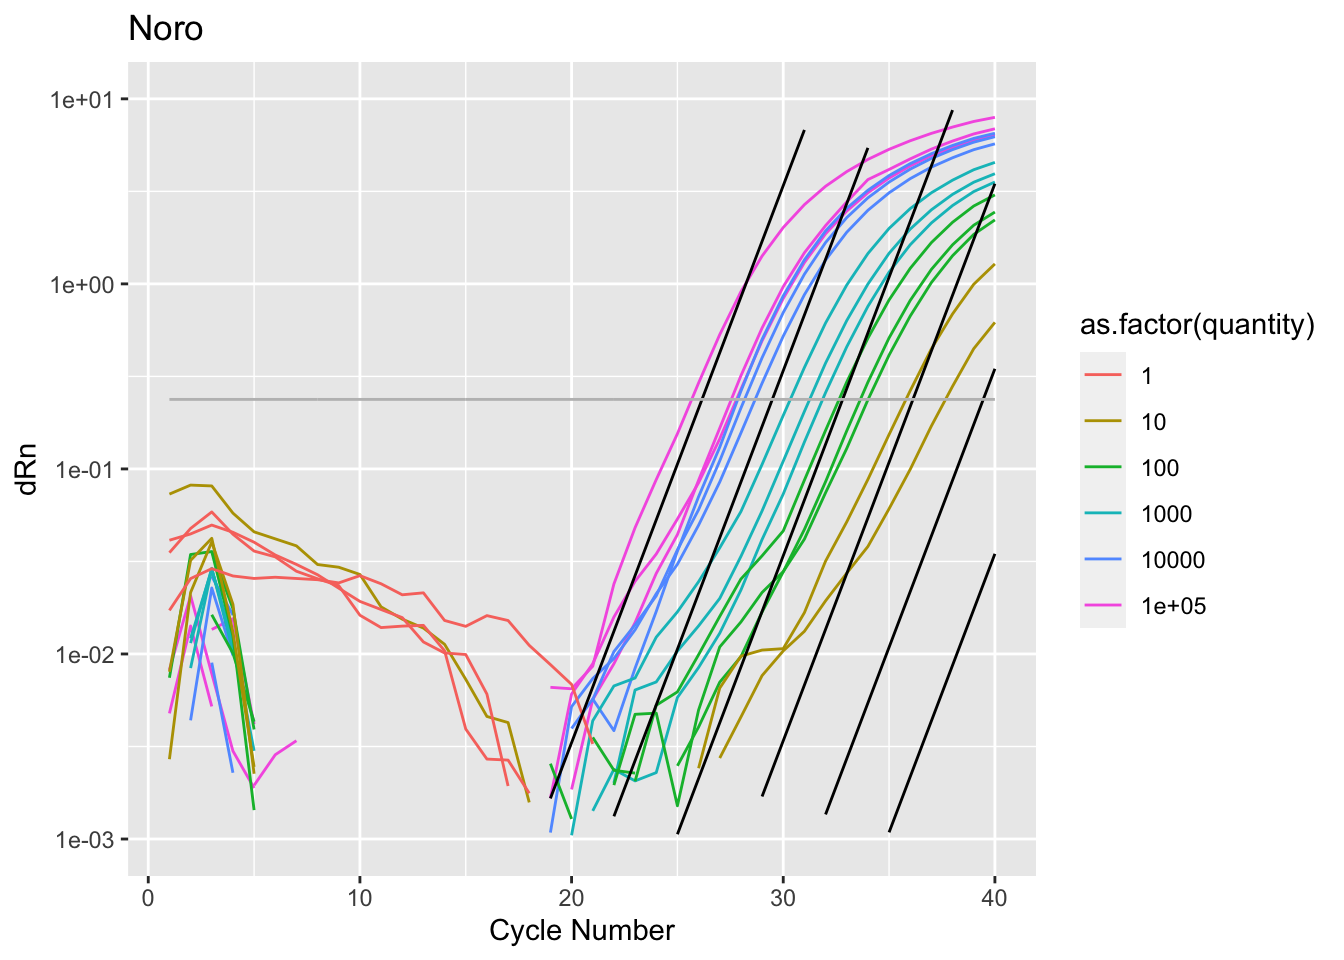
$ `Cycle Number`          <dbl> 1, 2, 3, 4, 5, 6, 7, 8, 9, 10, 11, 12, 13, 14,…
$ Target                  <chr> "Cov2", "Cov2", "Cov2", "Cov2", "Cov2", "Cov2"…
$ Rn                      <dbl> 0.6318336, 0.6287087, 0.6199436, 0.6148189, 0.…
$ dRn                     <dbl> 0.0186775648, 0.0154212920, 0.0065248104, 0.00…
$ Sample                  <dbl> 1e+05, 1e+05, 1e+05, 1e+05, 1e+05, 1e+05, 1e+0…
$ Omit                    <lgl> FALSE, FALSE, FALSE, FALSE, FALSE, FALSE, FALS…
$ Task                    <chr> "STANDARD", "STANDARD", "STANDARD", "STANDARD"…
$ Reporter                <chr> "FAM", "FAM", "FAM", "FAM", "FAM", "FAM", "FAM…
$ Quencher                <chr> "NFQ-MGB", "NFQ-MGB", "NFQ-MGB", "NFQ-MGB", "N…
$ `Amp Status`            <chr> "AMP", "AMP", "AMP", "AMP", "AMP", "AMP", "AMP…
$ `Amp Score`             <dbl> 1.336953, 1.336953, 1.336953, 1.336953, 1.3369…
$ `Curve Quality`         <lgl> NA, NA, NA, NA, NA, NA, NA, NA, NA, NA, NA, NA…
$ `Result Quality Issues` <lgl> NA, NA, NA, NA, NA, NA, NA, NA, NA, NA, NA, NA…
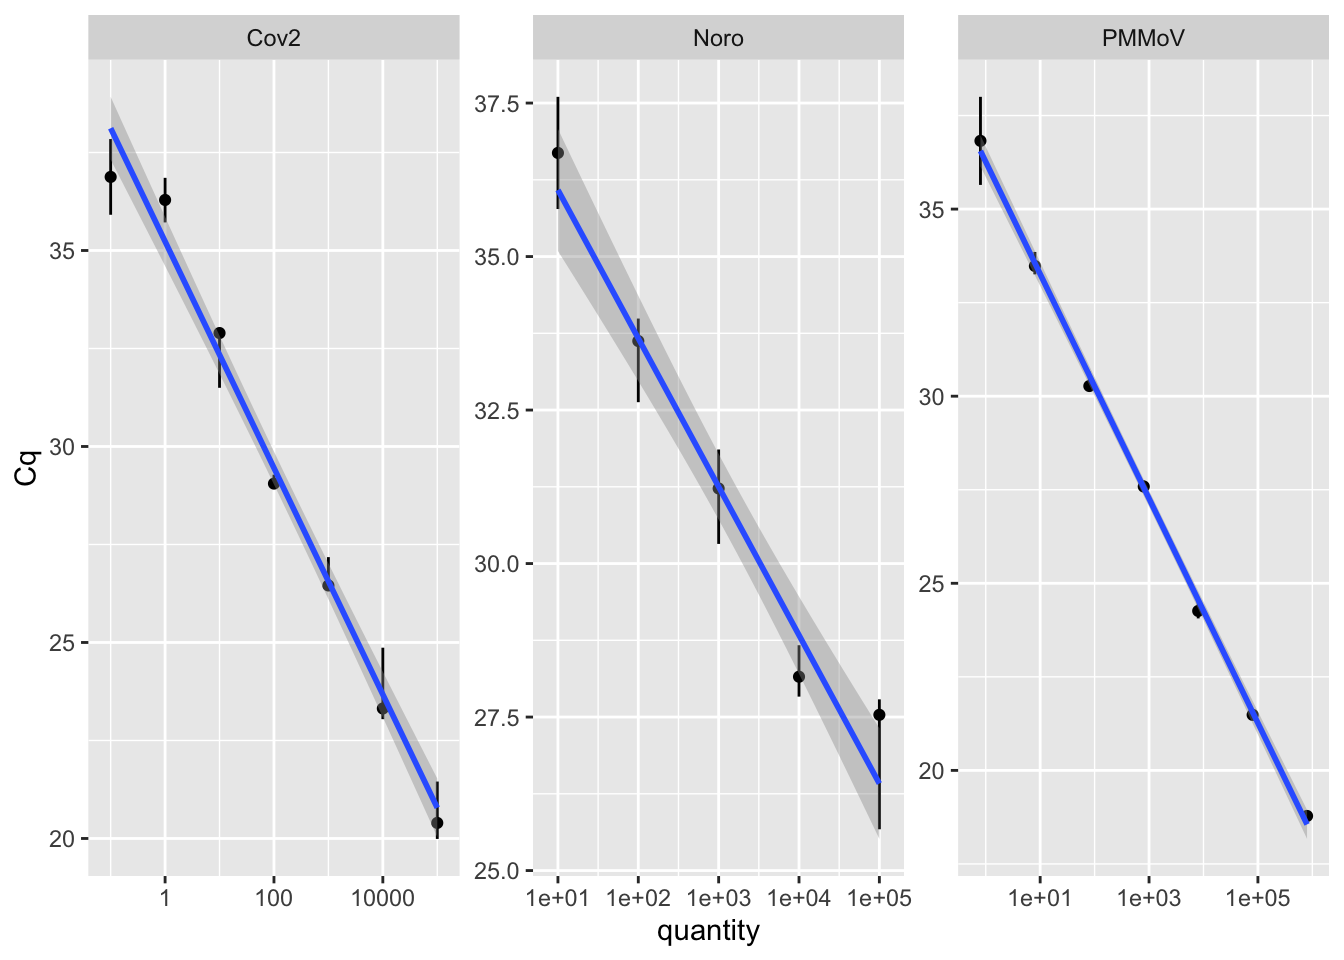
$ Cq                      <dbl> 19.98854, 19.98854, 19.98854, 19.98854, 19.988…
$ `Cq Confidence`         <dbl> 0.9907778, 0.9907778, 0.9907778, 0.9907778, 0.…
$ `Cq Mean`               <dbl> 20.61243, 20.61243, 20.61243, 20.61243, 20.612…
$ `Cq SD`                 <dbl> 0.755257, 0.755257, 0.755257, 0.755257, 0.7552…
$ `Auto Threshold`        <lgl> TRUE, TRUE, TRUE, TRUE, TRUE, TRUE, TRUE, TRUE…
$ Threshold               <dbl> 0.1399036, 0.1399036, 0.1399036, 0.1399036, 0.…
$ `Auto Baseline`         <lgl> TRUE, TRUE, TRUE, TRUE, TRUE, TRUE, TRUE, TRUE…
$ `Baseline Start`        <dbl> 3, 3, 3, 3, 3, 3, 3, 3, 3, 3, 3, 3, 3, 3, 3, 3…
$ `Baseline End`          <dbl> 15, 15, 15, 15, 15, 15, 15, 15, 15, 15, 15, 15…
$ quantity                <dbl> 1e+05, 1e+05, 1e+05, 1e+05, 1e+05, 1e+05, 1e+0…

Standard curves

tidy_data |>
  filter(Task == "STANDARD") |>
  ggplot(mapping = aes(
    x = quantity,
    y = Cq,
  )) +
  stat_summary(
    fun.min = min,
    fun.max = max,
    fun = median,
    position = position_dodge(width = 0.2),
    size = 0.2
  ) +
  scale_x_log10() +
  geom_smooth(method = "lm") +
  facet_wrap(facets = ~Target, scales = "free")
Warning: Removed 6 rows containing non-finite values (`stat_summary()`).
`geom_smooth()` using formula = 'y ~ x'
Warning: Removed 6 rows containing non-finite values (`stat_smooth()`).

fits <- tibble()
# Note: no standard for norovirus
for (target in unique(tidy_data$Target)) {
  fit <- lm(Cq ~ log10(quantity),
    data = filter(tidy_data, Task == "STANDARD", Target == target)
  ) |>
    tidy() |>
    mutate(Target = target, efficiency = 10^-(1 / estimate) - 1)
  fits <- bind_rows(fits, fit)
}
print(fits |> filter(term == "log10(quantity)"))
# A tibble: 3 × 7
  term            estimate std.error statistic  p.value Target efficiency
  <chr>              <dbl>     <dbl>     <dbl>    <dbl> <chr>       <dbl>
1 log10(quantity)    -2.89    0.103      -28.0 2.69e-16 Cov2         1.22
2 log10(quantity)    -2.42    0.180      -13.4 1.37e- 8 Noro         1.59
3 log10(quantity)    -3.00    0.0535     -56.0 1.18e-21 PMMoV        1.15

Notes:

  • PMMoV looks fine. Efficiency is a bit high and lowest concentration point is a bit noisy, but basically good.
  • Norovirus looks messy and efficiency is way too high.
  • Cov2 is intermediate

Amplification curves

plot_amp <- function(data, color) {
  ggplot(data, aes(x = `Cycle Number`, y = dRn)) +
    geom_line(mapping = aes(
      color = as.factor({{ color }}),
      group = Well,
    )) +
    scale_y_log10(limits = c(1e-3, 1e1))
}

ruler <- function(y0_from, num_rules) {
  y0 <- 10^seq(from = y0_from, by = -1, length.out = num_rules)
  rules <- crossing(`Cycle Number` = amp_data$`Cycle Number`, y0 = y0) |>
    mutate(y = y0 * 2^`Cycle Number`)
  geom_line(
    data = rules,
    mapping = aes(y = y, group = y0),
    color = "black"
  )
}

plot_amp_with_ruler <- function(target, y0_from, num_rules) {
  amp_data |>
    filter(!is.na(quantity), Target == target) |>
    plot_amp(quantity) +
    ruler(y0_from, num_rules) +
    geom_line(mapping = aes(
      x = `Cycle Number`,
      y = Threshold
    ), color = "Grey") +
    labs(title = target)
}

PMMoV

plot_amp_with_ruler("PMMoV", -7, 7)
Warning in self$trans$transform(x): NaNs produced
Warning: Transformation introduced infinite values in continuous y-axis
Warning: Removed 131 rows containing missing values (`geom_line()`).
Warning: Removed 196 rows containing missing values (`geom_line()`).

Curves look pretty clean (maybe a little steep) but the spacing is off on the dilutions. They look a bit under-diluted, which would explain the slightly too large efficiency.

SARS-CoV-2

plot_amp_with_ruler("Cov2", -7, 7)
Warning in self$trans$transform(x): NaNs produced
Warning: Transformation introduced infinite values in continuous y-axis
Warning: Removed 50 rows containing missing values (`geom_line()`).
Warning: Removed 196 rows containing missing values (`geom_line()`).

Curves are not as consistent as PMMoV and spacing is still too narrow. Slopes look ok.

Norovirus

plot_amp_with_ruler("Noro", -8.5, 6)
Warning in self$trans$transform(x): NaNs produced
Warning: Transformation introduced infinite values in continuous y-axis
Warning: Removed 100 rows containing missing values (`geom_line()`).
Warning: Removed 173 rows containing missing values (`geom_line()`).

Look really messy. Not spaced properly. Possibly have a slow phase and then a faster phase. Could this be because the PCR template doesn’t match the standard?

Raw Rn

plot_rn <- function(data, target) {
  data |>
    filter(Task == "STANDARD", Target == target) |>
    ggplot(aes(x = `Cycle Number`, y = Rn)) +
    geom_line(mapping = aes(
      color = as.factor(quantity),
      group = Well,
    )) +
    scale_y_log10() +
    labs(title = target)
}

Don’t really know what to make of these:

amp_data |> plot_rn("PMMoV")

amp_data |> plot_rn("Cov2")

amp_data |> plot_rn("Noro")

NTC

amp_data |>
  filter(Task == "NTC") |>
  ggplot(aes(x = `Cycle Number`, y = Rn)) +
  geom_line(mapping = aes(color = Target, group = Well))