2023-10-05 Qubit data exploration

Author

Dan Rice

Published

October 5, 2023

Objectives

Trying to understand the Qubit output.

Preliminary work

Ari exported the data from a recent (somewhat arbitrarily selected) run to a flash drive and put it here.

Olivia looked up the concentration of the standards and said:

The concentration of Std 1 is 0 ng/uL (TE buffer). Std 2 is 10ng/uL of rRNA (also in TE buffer).

The Assay Kit User guide is here

Data import

library(here)
here() starts at /Users/dan/notebook
library(tidyverse)
── Attaching core tidyverse packages ──────────────────────── tidyverse 2.0.0 ──
✔ dplyr     1.1.3     ✔ readr     2.1.4
✔ forcats   1.0.0     ✔ stringr   1.5.0
✔ ggplot2   3.4.3     ✔ tibble    3.2.1
✔ lubridate 1.9.2     ✔ tidyr     1.3.0
✔ purrr     1.0.2     
── Conflicts ────────────────────────────────────────── tidyverse_conflicts() ──
✖ dplyr::filter() masks stats::filter()
✖ dplyr::lag()    masks stats::lag()
ℹ Use the conflicted package (<http://conflicted.r-lib.org/>) to force all conflicts to become errors
data_dir <- here("_data", "qubit")
data_raw <- read_csv(here(data_dir, "QubitData_10-05-2023_08-32-08.csv"))
Rows: 14 Columns: 17
── Column specification ────────────────────────────────────────────────────────
Delimiter: ","
chr (8): Run ID, Assay Name, Test Name, Test Date, Qubit tube conc. units, O...
dbl (7): Qubit tube conc., Original sample conc., Sample Volume (uL), Diluti...
lgl (2): Std 3 RFU, Green RFU

ℹ Use `spec()` to retrieve the full column specification for this data.
ℹ Specify the column types or set `show_col_types = FALSE` to quiet this message.
glimpse(data_raw)
Rows: 14
Columns: 17
$ `Run ID`                      <chr> "2023-09-11_165152", "2023-09-11_165152"…
$ `Assay Name`                  <chr> "RNA High Sensitivity", "RNA High Sensit…
$ `Test Name`                   <chr> "Sample_#230911-165447", "Sample_#230911…
$ `Test Date`                   <chr> "09/11/2023 04:54:47 PM", "09/11/2023 04…
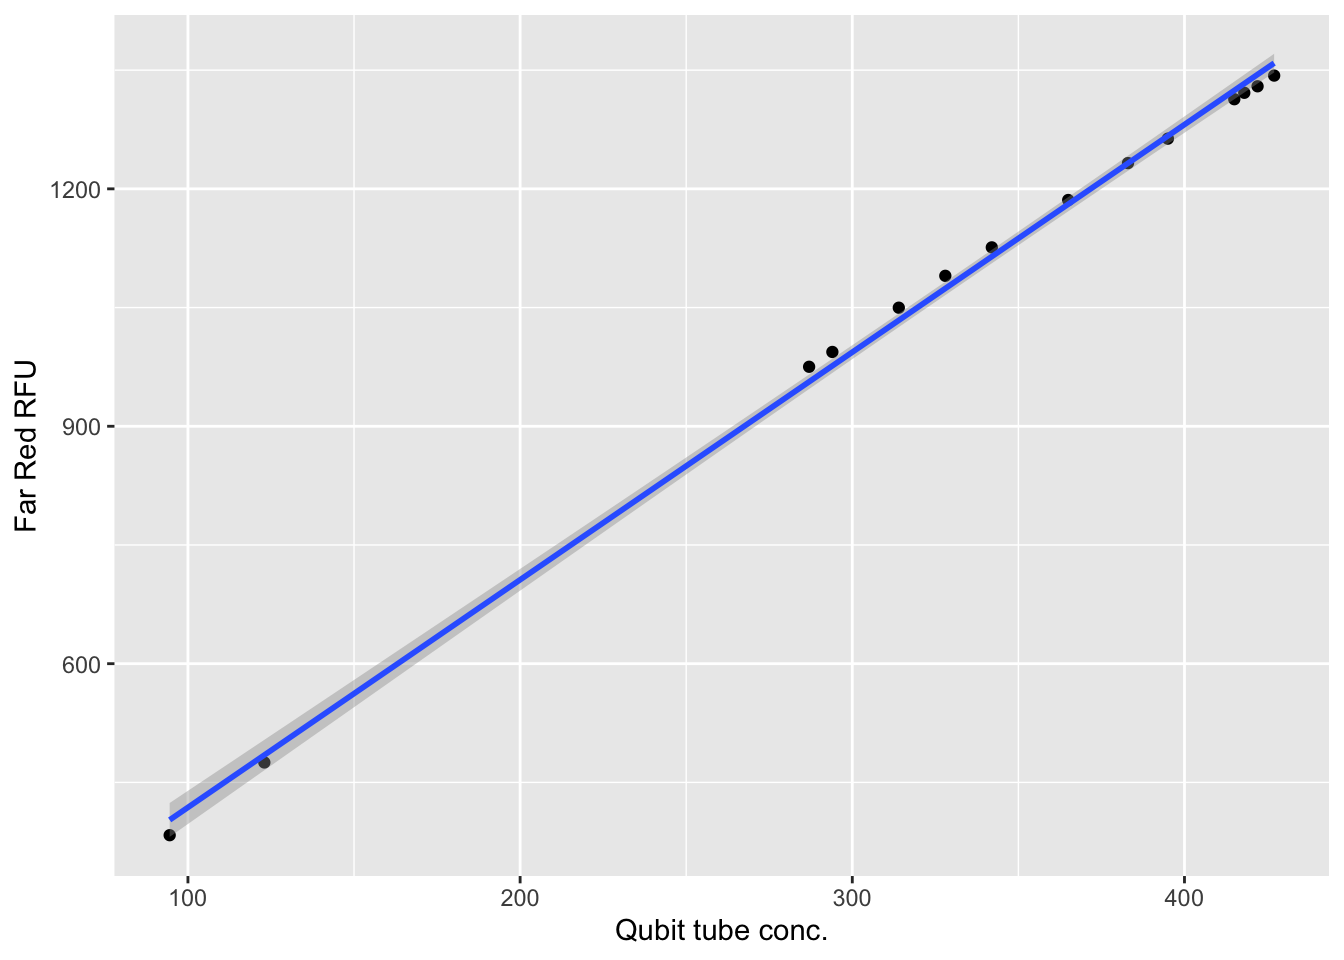
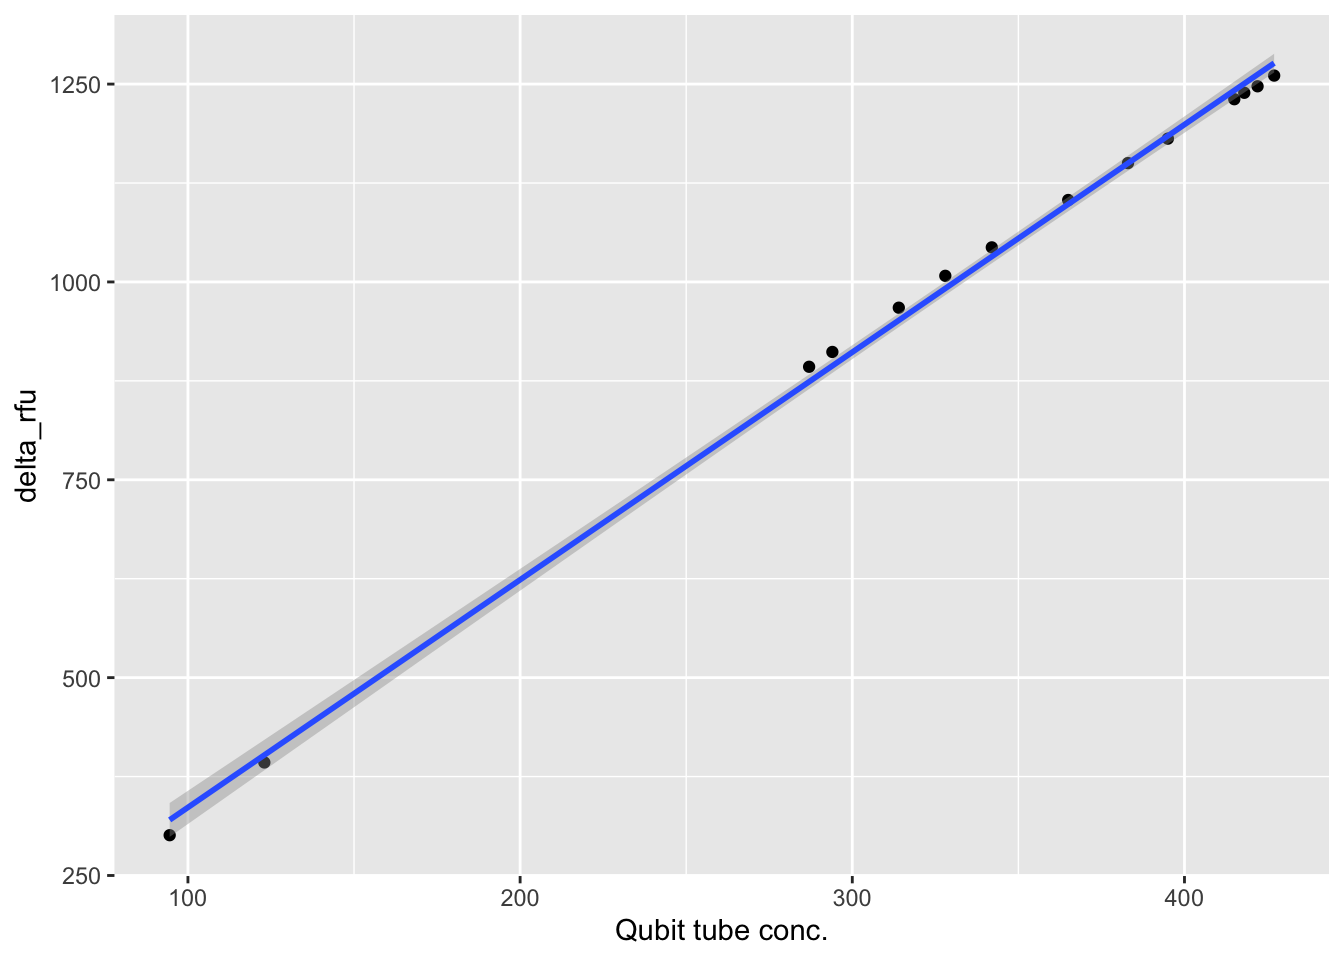
$ `Qubit tube conc.`            <dbl> 123.0, 422.0, 415.0, 294.0, 287.0, 328.0…
$ `Qubit tube conc. units`      <chr> "ng/mL", "ng/mL", "ng/mL", "ng/mL", "ng/…
$ `Original sample conc.`       <dbl> 4.92, 16.90, 16.60, 11.80, 11.50, 13.10,…
$ `Original sample conc. units` <chr> "ng/uL", "ng/uL", "ng/uL", "ng/uL", "ng/…
$ `Sample Volume (uL)`          <dbl> 5, 5, 5, 5, 5, 5, 5, 5, 5, 5, 5, 5, 5, 5
$ `Dilution Factor`             <dbl> 40, 40, 40, 40, 40, 40, 40, 40, 40, 40, …
$ `Std 1 RFU`                   <dbl> 82.37, 82.37, 82.37, 82.37, 82.37, 82.37…
$ `Std 2 RFU`                   <dbl> 1514.1, 1514.1, 1514.1, 1514.1, 1514.1, …
$ `Std 3 RFU`                   <lgl> NA, NA, NA, NA, NA, NA, NA, NA, NA, NA, …
$ Excitation                    <chr> "Red", "Red", "Red", "Red", "Red", "Red"…
$ Emission                      <chr> "Far Red", "Far Red", "Far Red", "Far Re…
$ `Green RFU`                   <lgl> NA, NA, NA, NA, NA, NA, NA, NA, NA, NA, …
$ `Far Red RFU`                 <dbl> 475.18, 1329.59, 1313.26, 993.90, 975.18…
data <- data_raw |>
  mutate(delta_rfu = `Far Red RFU` - `Std 1 RFU`)

Concentration curves

My first guess is that the relationship between concentration and RFU should be linear.

data |>
  ggplot(mapping = aes(y = `Far Red RFU`, x = `Qubit tube conc.`)) +
  geom_point() +
  geom_smooth(method = "lm")
`geom_smooth()` using formula = 'y ~ x'

It is not.

data |>
  ggplot(mapping = aes(y = delta_rfu, x = `Qubit tube conc.`)) +
  geom_point() +
  # scale_y_continuous(trans="log10") +
  # scale_x_continuous(trans="log10") +
  geom_smooth(method = "lm")
`geom_smooth()` using formula = 'y ~ x'